
| SYLLABUS: Indian Economy General Studies – : III Indian Economy and issues relating to planning, mobilization of resources, growth, development and employment. |
IN NEWS: What India’s growth really means
QUESTION: What is the significance of distinguishing between GDP and GVA while assessing the performance of the Indian economy? Explain with suitable examples.
(10 marks, 150 words)
ANSWER: Understanding the distinction between Gross Domestic Product (GDP) and Gross Value Added (GVA) is critical for macro-analysis, monetary policy formulation, and sector-level performance tracking in India. While both serve as key indicators of national income, they measure economic activity from opposite ends of the economic spectrum.
Conceptual Distinction
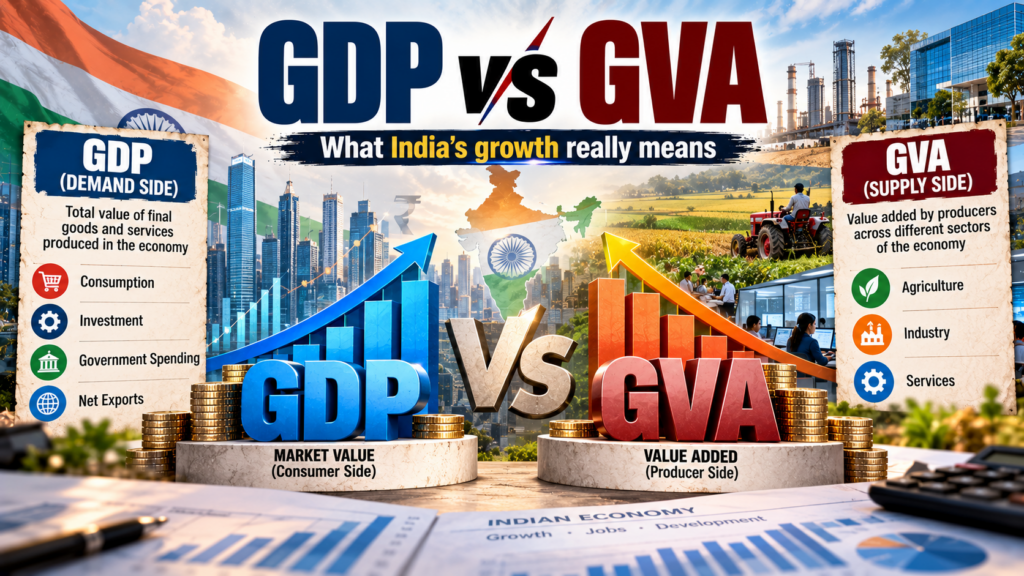
- Gross Value Added (GVA): Measures economic performance from the supply/producer side. It calculates the net value added across key sectors—Agriculture, Industry, and Services—before taking government taxes and subsidies into account.
- Gross Domestic Product (GDP): Measures performance from the demand/consumer side. It calculates the market value of all final goods and services produced within the country’s borders, incorporating net product taxes (Indirect Taxes minus Subsidies).
Key Differences Between GDP and GVA
- Perspective: GVA evaluates the economy from the producer and supply side, whereas GDP measures it from the consumer and aggregate demand side.
- Sectoral Insights: GVA breaks down structural strengths and weaknesses across individual sectors like Agriculture, Manufacturing, and Services. GDP provides a single aggregate metric reflecting total economic size and global standing.
- Tax and Subsidy Impact: GVA is unaffected by fiscal policy interventions or tax rate adjustments. GDP is highly sensitive to changes in tax collections and government subsidy payouts.
- Policy Application: GVA is used primarily by the Reserve Bank of India (RBI) and sector ministries for targeted supply-side interventions. GDP is used for international comparisons, fiscal deficit targeting (as a percentage of GDP), and macroeconomic forecasting.
Significance of Distinguishing GDP and GVA in India
1. Disentangling Production Growth from Fiscal Distortions
GDP can paint a misleading picture of economic health if there are significant fluctuations in tax collections or subsidy payments, even when real underlying production remains unchanged.
Example (Subsidies Collapse): During FY 2020–21, when the Indian government cleared massive food subsidy backlogs owed to the Food Corporation of India (FCI), total subsidy payouts spiked. This caused Net Indirect Taxes to drop sharply, making GDP growth appear significantly lower than actual baseline sector output captured by GVA.
2. Sector-Specific Performance & Policy Targeting
GDP provides an aggregate overview, whereas GVA reveals structural issues that need targeted policy intervention.
Example (K-shaped Recovery): Post-pandemic recovery data showed high overall GDP growth driven by services and high-end consumption. However, sector-level GVA revealed persistent weakness in low-margin manufacturing and informal services, prompting targeted schemes such as the Emergency Credit Line Guarantee Scheme (ECLGS) and sector-specific Production Linked Incentive (PLI) frameworks.
3. Analyzing the Impact of Indirect Tax Reforms (GST)
Higher collections from the Goods and Services Tax (GST) directly boost GDP by increasing net product taxes, even if underlying physical production growth remains moderate.
Example (Tax Compliance Gains): Increased tax compliance and digital enforcement can raise GST revenues. This widens the gap where GDP exceeds GVA, signaling that reported national income growth is driven by tax formalization rather than expanding industrial output.
4. Cushioning External Commodity Shocks
Fluctuations in global crude oil prices directly impact government subsidy burdens (e.g., fuel and fertilizer subsidies), creating significant divergence between GDP and GVA figures.
Example (Oil Price Volatility): A surge in global crude oil prices forces higher government fertilizer and LPG subsidies. Increased subsidies lower net indirect taxes, depressing GDP relative to GVA—even if agricultural and industrial output remain healthy.
Divergence Dynamics and Interpretation
- When GDP exceeds GVA: This scenario indicates robust net indirect tax collection, reduced subsidy burdens, and progressive formalization of the economy.
- When GVA exceeds GDP: This scenario indicates elevated subsidy payouts, lower tax revenues, or targeted fiscal intervention during economic stress.
Evaluating GDP and GVA together ensures that policymakers, the RBI, and market analysts avoid misinterpreting fiscal adjustments as real output trends, enabling balanced decision-making across both demand and supply sides of the economy.
|
SOURCE: The Hindu e-paper – What India’s growth really means